outREACH Workshop Video 3 – Measuring the Quality of Links
This is the third and final video from our free outREACH workshop. This was a series of workshops teaching actionable tips and techniques that will enhance your creative content and link-building strategy.
In this third part of the series, James Finlayson, Head of Strategy, discusses different methods for measuring the quality of your outreach efforts. He also talks about history of updates and how this has impacted the way we look at links.
If you haven’t already seen the first in the series, feel free to follow this link and check out Lisa Myers, the CEO and Founder of Verve Search, as she goes through the concept and ideation process of creative campaigns. You can also see Alex Cassidy’s presentation here to learn more about our team’s outreach strategy.
Join us for our next event. On 12th June we are hosting outREACH Online Conference which is a fantastic opportunity for you, or members of your team to hear from the best SEO’s, link-developers, content creators and marketers in the industry including marketing wizard Rand Fishkin, Shannon McGuirk (Aira), Carrie Rose (Rise at Seven), our very own Lisa Myers and many many more. We hope that you’ll be able to join us for this event.
If you have any questions about this content or outREACH Online please contact us at [email protected].
How much are newspapers writing about Covid?
It might not feel like it, but coverage of coronavirus in the UK is reducing and has been reducing for over a month. With less than a quarter of all stories now being COVID focussed (down from a high of nearly 40%), journalists are desperate for positive, feel-good news. We took a look at what that means for outreach in exceptional times.
Our data
At the start of March, we heard from a lot of companies concerned that there was no room for brands in newspapers clamouring to cover the coronavirus. We were asked, frequently, whether it made sense to just stop outreaching entirely rather than trying to cut through the noise.
For the last 9 or so months, we’ve had a project underway where we’ve been scraping the major newspapers around the world. This data, now including over a million articles, provides us with unique insight into quite what’s being written about.
We decided to mine the data to see how many articles are being written about COVID. For this exercise, we defined an article as being about COVID if it mentioned ‘COVID’, ‘coronavirus’, ‘pandemic’, ‘furlough’, ‘quarantine’ or ‘lockdown’ in its title. This was to avoid including any articles that mentioned coronavirus but weren’t about coronavirus. We also limited this particular analysis to UK newspapers; I’m sure there’s a great piece of analysis to be done on how much coronavirus is being discussed in different countries, but that’s for another post.
What we found
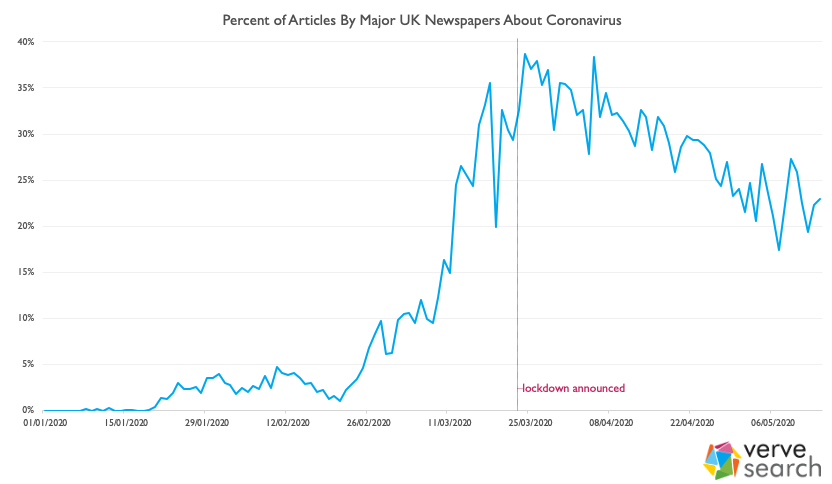
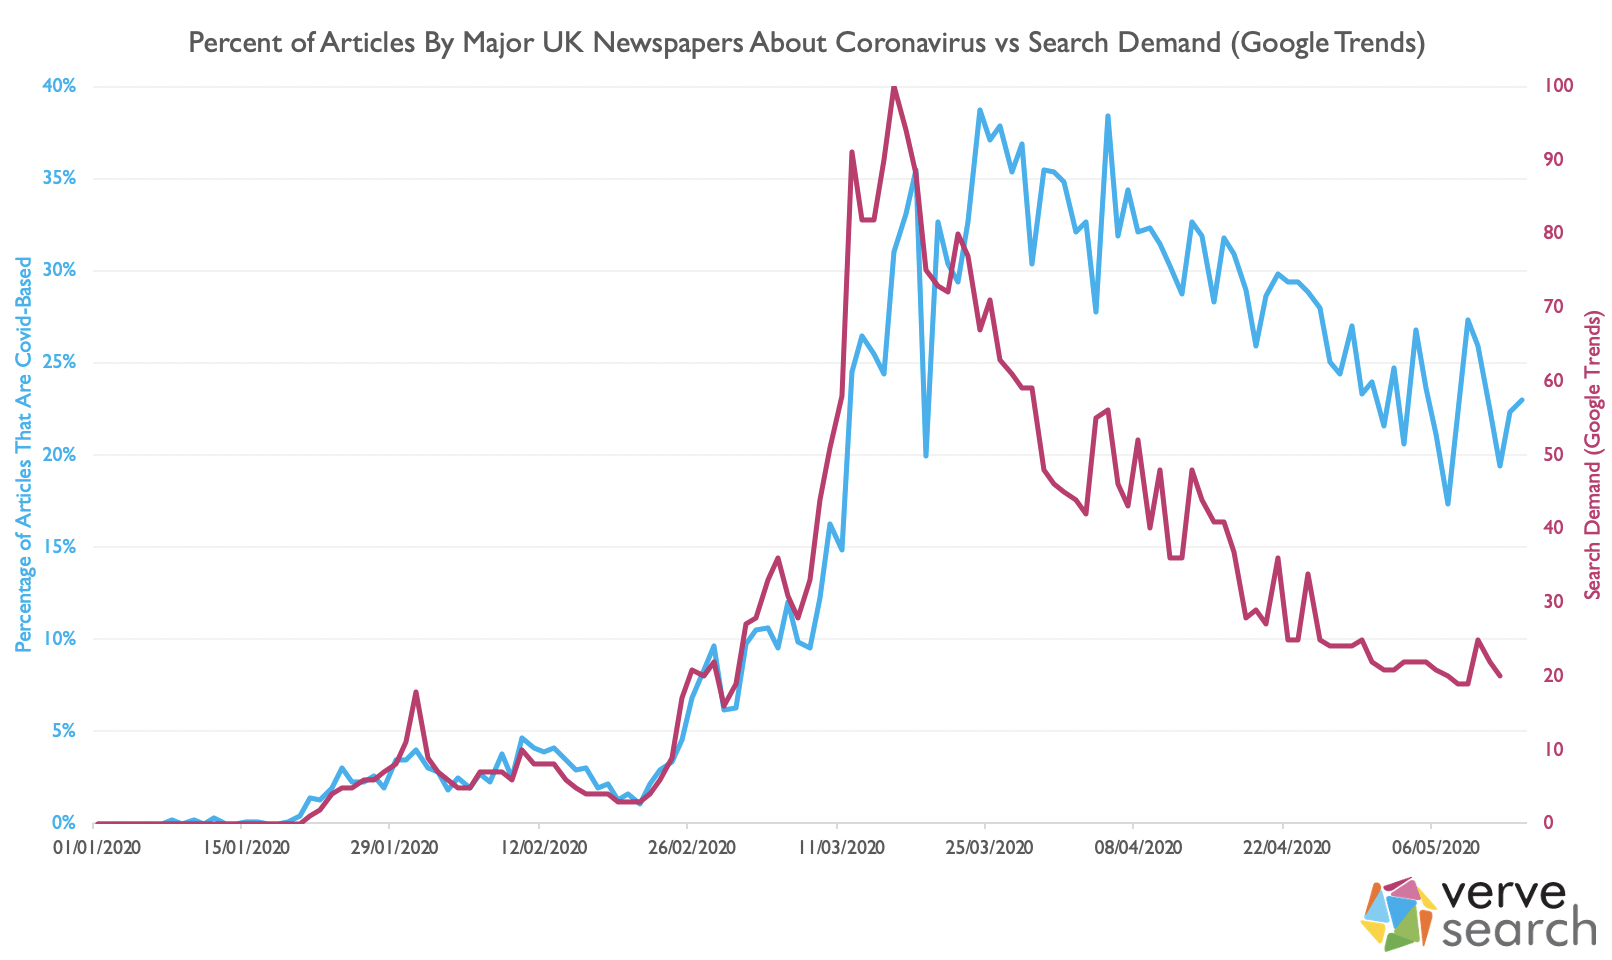
Coronavirus stories were a very small part of the media landscape early this year. It wasn’t until 25th February that COVID stories made up more than 5% of the news cycle. It would take 3 days for this figure to double and less than two weeks more for it to double again to just over 20%. Just after the lockdown was implemented, on the 24th March, coverage of coronavirus in the UK peaked, with 39% of all articles being COVID focussed. That has been dropping, relatively consistently, ever since. Last Thursday, as the nation prepared itself for a long weekend and VE day celebrations, coronavirus stories dipped to just 17%; the lowest it had been since early March.
Whilst 39% is undoubtedly a lot – thousands of articles each week on a single subject – it’s probably much less than you’d think if I’d asked you to guess. As you’ll have found out if you’re currently outreaching though, whilst coronavirus stole the frontpages and the headlines the newspaper industry has still been pushing out stories. Even at its highest, the majority of stories were not about coronavirus – and we’re now far from that peak.
Journalists’ stories follow public interest. This has never been more true than with coronavirus. If we look at UK Google trends data, we see both search volume and articles practically in lock-step with each other; articles following the previous couple of days search-demand:
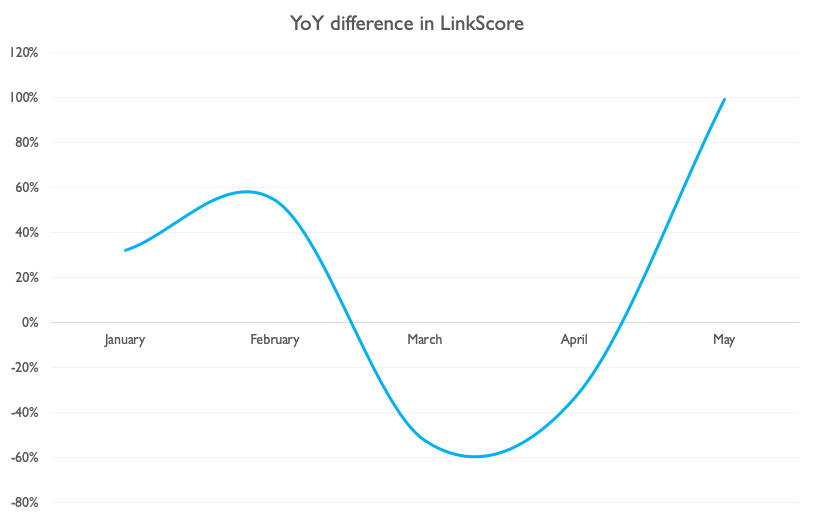
At Verve, we use LinkScore to value the links that we build in a way that’s consistent, objective and takes into account a whole plethora of key factors (relevance, site authority, no-follow status, whether it’s syndicated etc), which allows us to easily compare our outreach output year on year. When we did, we saw a picture that mirrors the above up until this last month:
Considering that, since February, we’ve had some clients on hold and some of the team is furloughed, May’s data represents more than a return to the previous form. Even with the reduction in coronavirus stories, there’s more going on. So, you might wonder, why are we seeing such results recently?
What’s Working?
1. Keeping a positive mental attitude
Lisa’s talked previously about how a lot of outreach success can be attributed to attitude and grit. Finding yourself unexpectedly working from home, with strict government measures imposed and every newspaper headline seemingly dedicated to coronavirus can knock your confidence. Here are a few ways to keep it high:
(a) Share your wins
As a result, sharing wins (something we were already doing) became even more important. We have a Slack channel, we call Linkbell, dedicated to new links as they go live:
We also share, across a couple of other channels, TV, radio and print coverage:
(b) Realise there’s now less competition
According to ONS figures, 27% of the UK workforce has now been furloughed. If we assume that the figures as roughly equal for the PR and SEO sectors, this would have a substantial effect on the level of competition when emailing journalists…so we decided to look at two different metrics to estimate the effect of furloughing on these industries:
1. Back at the end of April, PR Week reported that 35% of PR firms reported having furlough around a quarter of their team, with a further 25% having furloughed some, but less than 25% of their team. If we assume an even distribution on that 25%, we can estimate that, in total, around 12% of the PR workforce in the UK is currently furloughed.
2. We investigated this by looking at the number of press releases that had been published on PRNewswire this year. Now, we know that news wires are decidedly old-hat, but that was as true in January as it is now, so any change in the last few months can be considered meaningful.
If we assume that the rate of press releases being published would have continued at the rate it was at in late February, press releases are down 21%.
Based on these two measures, journalists should currently be receiving 12%-21% fewer pitches; that’s less noise to cut through and that makes it ‘easier’ to achieve coverage.
Take the time to also Google the brand names of your competitors. It’s possible they chose to pause their link building and, if they did, know that each link you build is either extending your lead or working towards catching them up.
(c) Stay connected
One of the things a lot of us love about SEO is the community so, now, more than ever, it’s important to be a part of it. I find value in the BigSEO Slack group and can often be found lurking in the outREACH Community Slack. Meanwhile, there are virtual conferences galore; not least SMX Next and outREACH Online.
2. Positive news
Lots has been written on this, not least by Verve’s own Sean, but when the news turns bleak people seek out the uplifting and irreverent. That’s partly why we’ve seen stories about:
A pensioner pacing his garden – and raising £33 million in doing so.
Chance the Rapper handing out an award to a rapping teacher.
Those didn’t just sneak under the radar; journalists have been actively calling out for positive news:
OK Yorkshire, here’s my challenge. I want as much non-coronavirus-related news as I can find. PR teams, big opportunity here for you to showcase interesting and genuine activity with your clients. Our readers don’t just want to read Covid-19 stuff. Now is your chance to shine.
Looking for original travel feature ideas – not just UK-focused. Need inspiring, bucketlist, planning for future, retrospective and funny feature ideas. Have budget. Help! #journorequest
Hello #PR friends! We can’t write a whole paper about Coronavirus. We don’t want to. We need your non-CV themed stories more than ever. Fun stuff especially. Email in my bio! #journorequest
It’s no surprise to say that if you are in a position to talk authoritatively about coronavirus then there’s a lot of link opportunities. There are more subtle opportunities though. That’s because several industries just don’t have much going on because of social distancing. Film, sport and travel journalists, for example, have all had the big events that typically punctuate their calendars either cancelled or paired down. Whilst this also means that some campaigns, and headlines, just don’t make sense at the moment (e.g. cheap holiday deals in travel) a great headline could do better than ever.
There are also opportunities to craft content and campaigns around areas that people are searching for more of because of being stuck at home including:
Topic
YoY Change
Working from home
+614%
Online lessons
+378%
Virtual tour
+342%
Cocktail recipes
+321%
Pogo stick
+209%
Classic movies
+208%
Baking
+190%
Adoption
+138%
DIY
+87%
We’ve seen this in action with a few different movie-themed campaigns, but we’re also seeing gains on nostalgic content (as ‘classic movies’ implies). You can read about one of those campaigns here.
In Summary
Consumer behaviour is changing, and journalists are changing their coverage with it. With articles on coronavirus reducing every day and many companies yet to return their marketing teams from furlough, we’re now seeing over-sized returns from link building again. If you can put together a headline that touches people and creates discussion you’ll find high relevancy, high authority links follow.
4 Things You Never Knew About Sitemap Submissions
Whenever a sitemap changes it’s important to notify Google and Bing of the change by pinging <searchengine_URL>ping?sitemap=sitemap_url . Whilst these URLs are meant for bots, they do return an actual html page. When you look at Google’s responses though, you’ll notice four interesting facts:
1. Google is Tracking Views of the Page
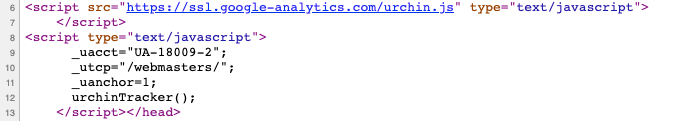
It’s fair to say that 99.9% of page loads for the URLs are by automated systems that do not run javascript. It’s interesting, and surprising, then that Google includes the old GA script within the code:
For reference, that UA-code appears to be a property within the same account as Google’s Search Console, but not part of the actual Google Search Console property (UA-1800-36).
2. Google.com still refers to Webmaster Tools
If you load up google.com/ping?sitemap=example.com you’ll find that the page’s title is:
3. Google shows a different response for different languages
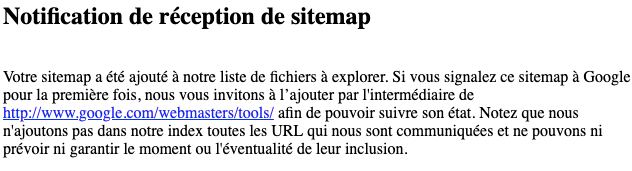
If you load up non-English Google TLDs you start to see that Google’s taken the time to translate the text into the primary language that TLD targets. For example, here’s the response on google.fr:
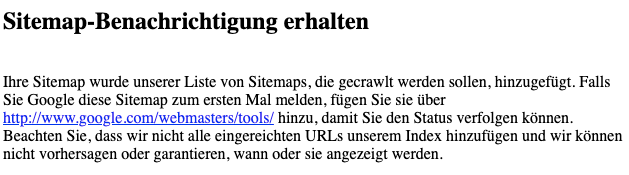
and here’s the response on google.de:
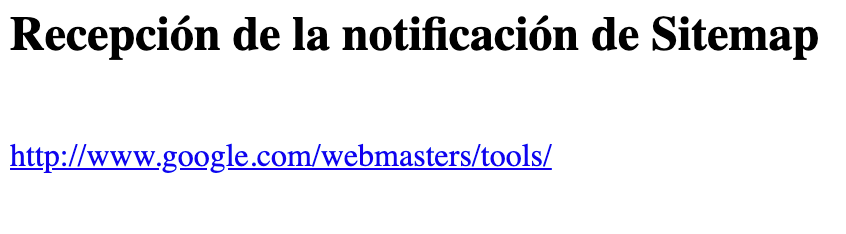
Each language gets its own translation of the text…. except for google.es:
I guess the google.es sitemap country-manager was out the day they wrote the translations! In any case, it’s surprising that they bothered to create all these translations for a page that, I would imagine, is very rarely seen by a human.
4. Google makes the weirdest grammar change
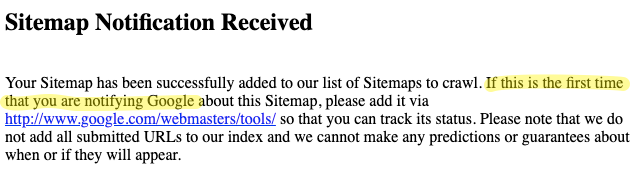
If you load up the the .co.uk, .ie, .co.za or any ‘international’ English version of Google’s sitemap ping URL you’ll find this message:
(we’ve added the highlighting)
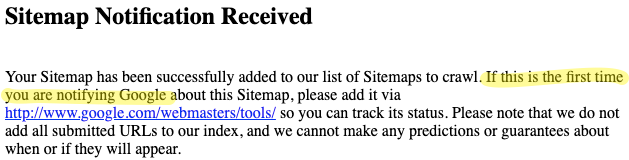
If, however, you load up the .com you receive this:
The ‘that’ in the second sentence disappears.
Why would Google do any of these things? Maybe it just doesn’t care about updating these. Maybe all of the international English-language versions share a single ‘international English’ text and, when someone last updated it, they forgot to update the .com version. Here’s the more interesting question, though. If the ping URL’s frontend is different for each Google TLD, then, does that mean the backend could be different – maybe feeding into their different indexes? Does which Google you ping make any difference? Should you be pinging your ‘local’ Google rather than just the .com?
We pinged our test site about 40 times from various TLDs to see, through our log files, if Google was visiting from different IP addresses when you pinged from a different TLD. It wasn’t. Next, we reached out to John Mueller to see what he had to say:
I’d use the officially documented ping URL. Others might work, or might not — the documented one is the one we officially support.
What’s The Limit On Google’s Live Inspection Tool?
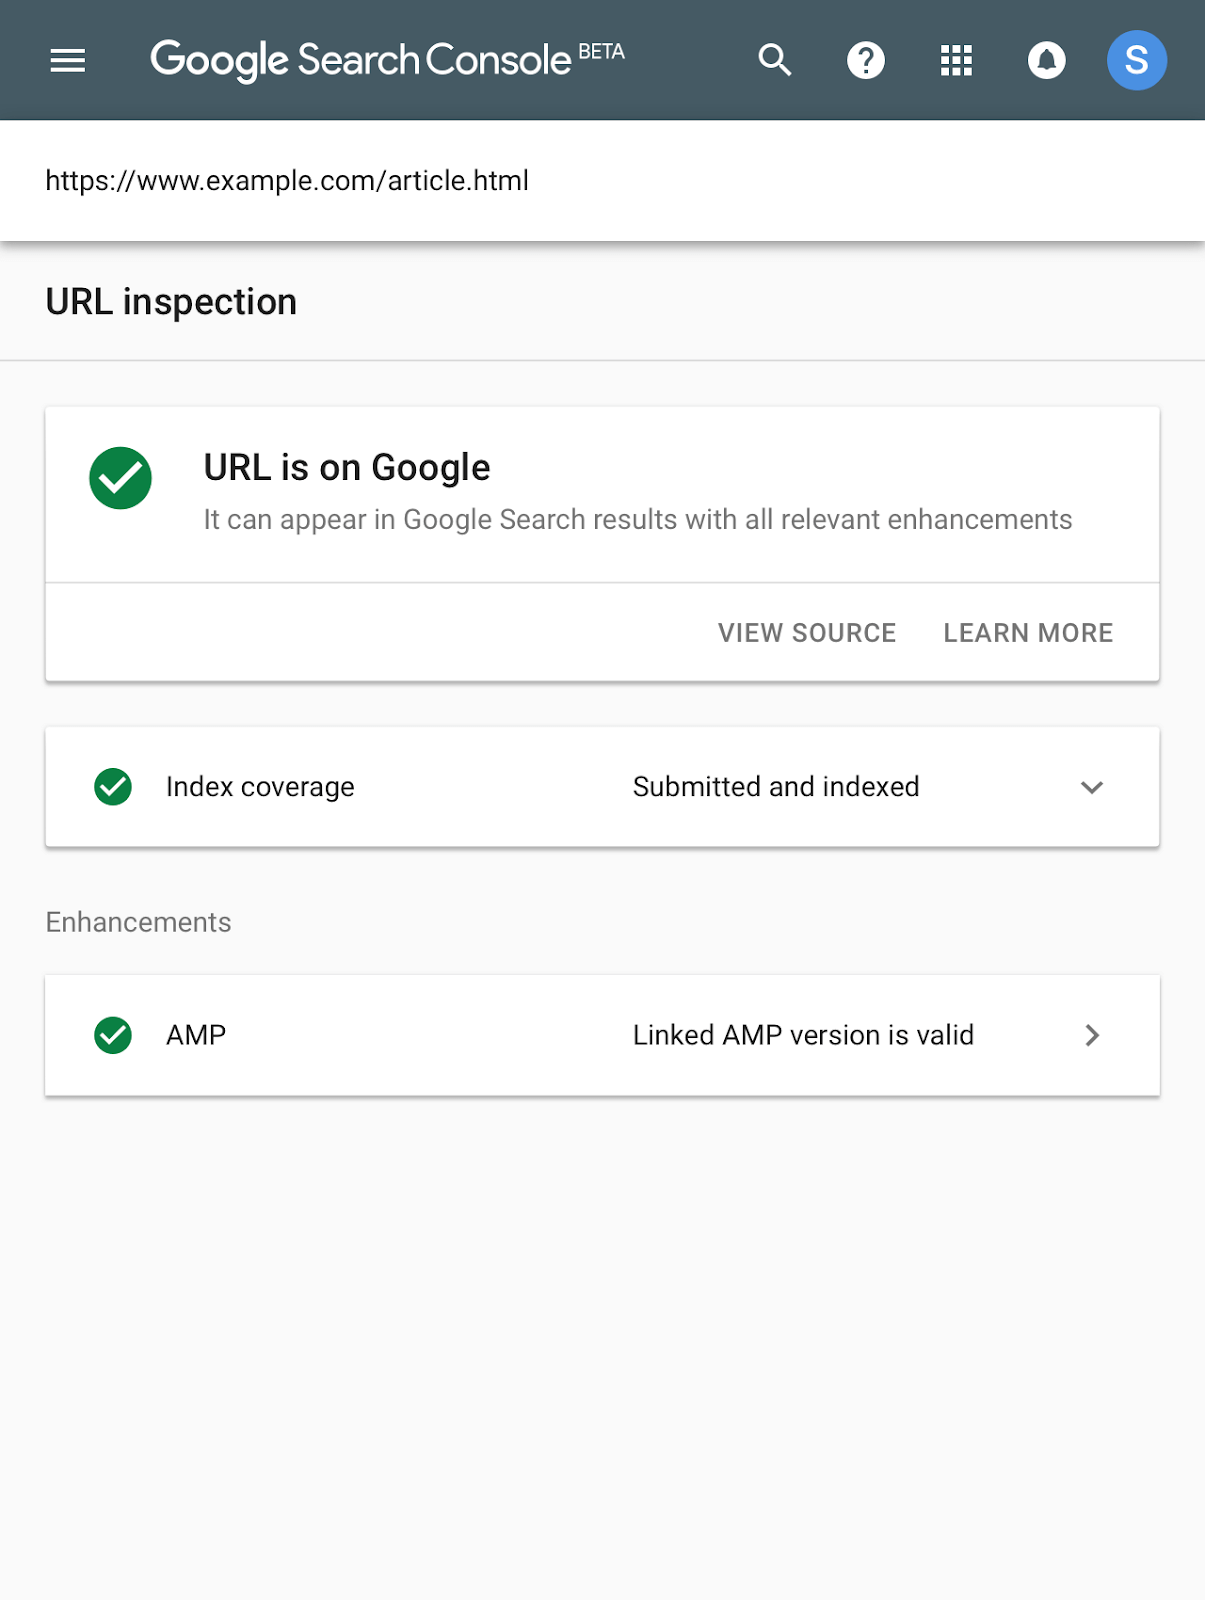
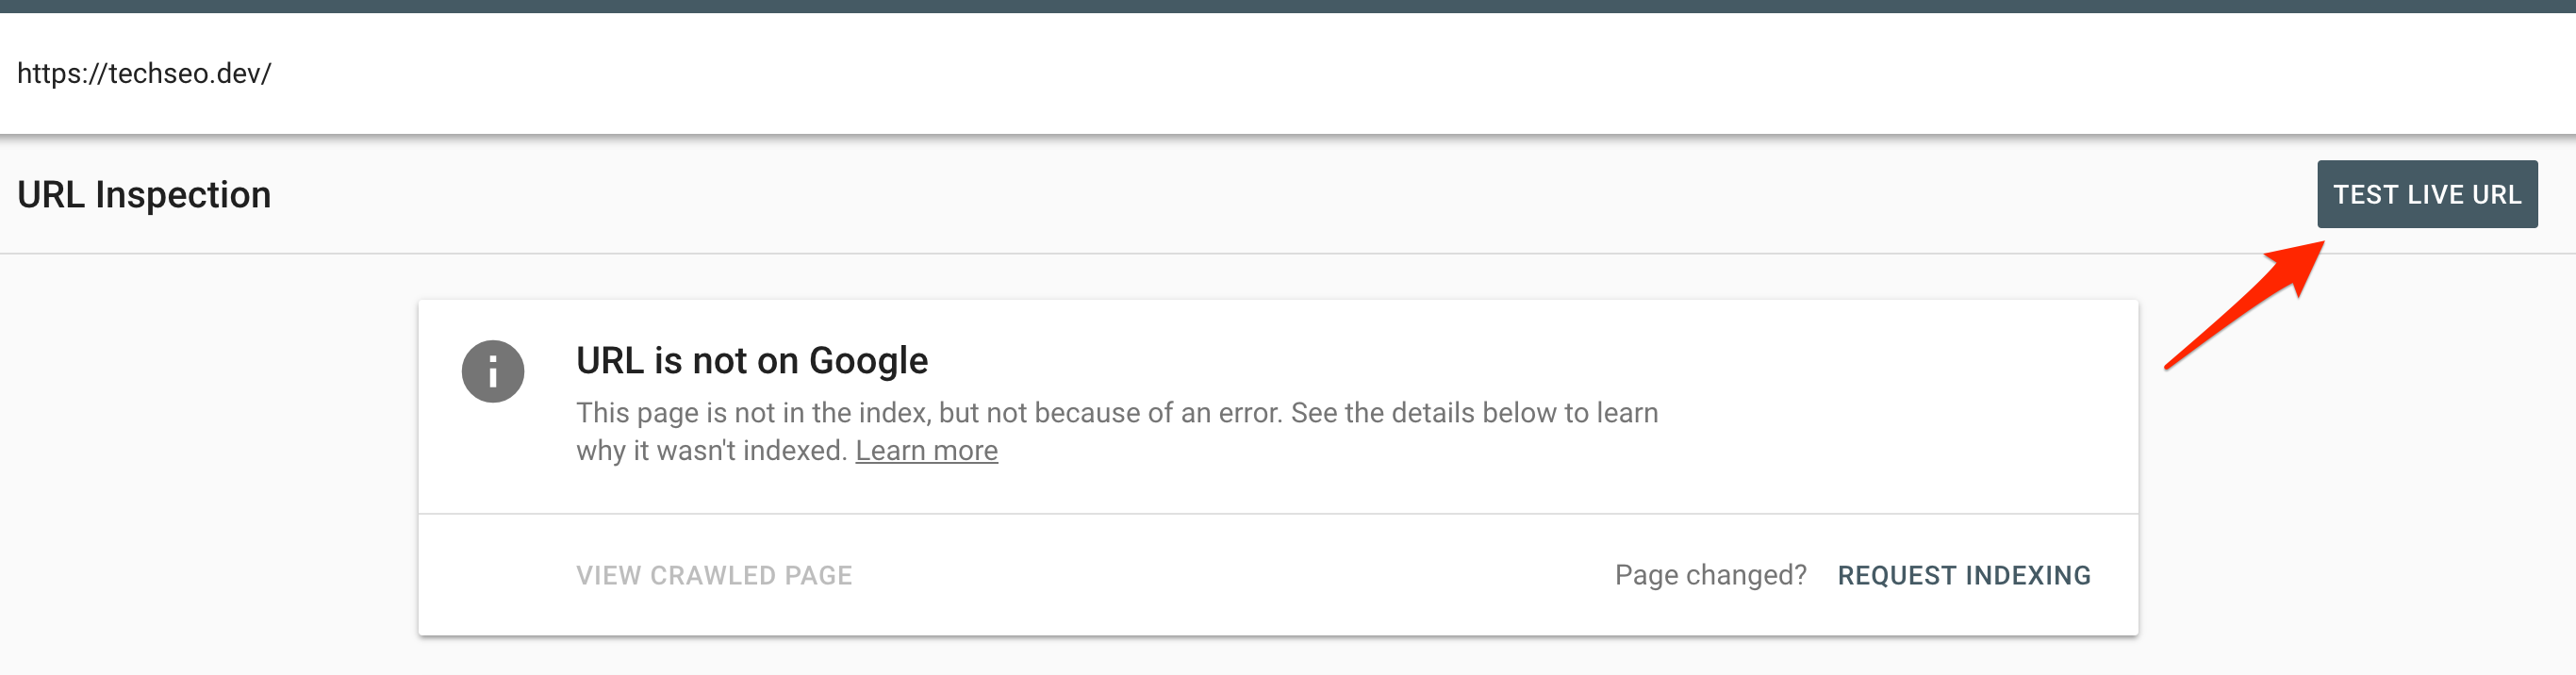
Last year Google launched the beta of the new Google Search Console, but when it first launched it was pretty empty. By June they had added one of the features I now use most often in it, the URL Inspection tool. It allows you to quickly see details as to how Google’s crawling, indexing and serving a page, request that Google pulls a ‘live’ version of the page and request that it’s (re)indexed:
The Live Inspection Tool will soon replace the ‘fetch as Google’ functionality found in the old Search Console and so it’s worth considering how moving to the new version might limit us.
The old fetch and render used to be limited to 10 fetches a month – and had a clear label on it allowing the user to know exactly how many fetches they had remaining. This label disappeared in February last year, but the actual limit remained:
Yes, there are still limits. I’d really aim to use the more scalable approaches (like having a crawlable site, sitemaps, etc) instead of trying to fudge-force indexing manually.
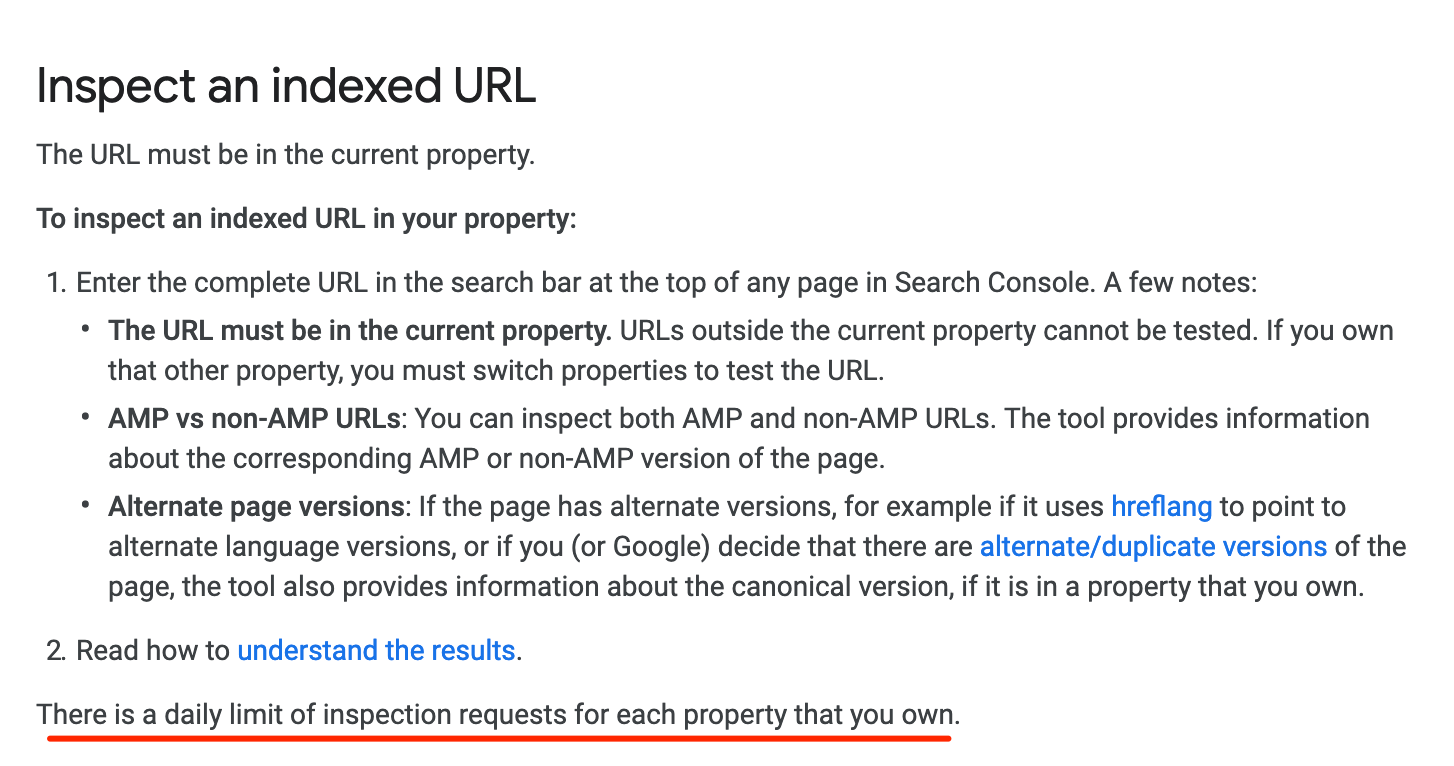
Since the Live Inspection Tool is far more about understanding and fixing problems with a page than the old ‘fetch as Google’ tool – which I, at least, mostly used to force a page to be indexed/re-crawled – it makes sense for the Live Inspection Tool to have a higher limit. Yet there’s no limit listed within the new tool. We turned to Google’s documentation and, honestly it could be more helpful:
So, dear readers, we decided to put the Live Inspection Tool to the test with a methodology that can only describe as ‘basic’.
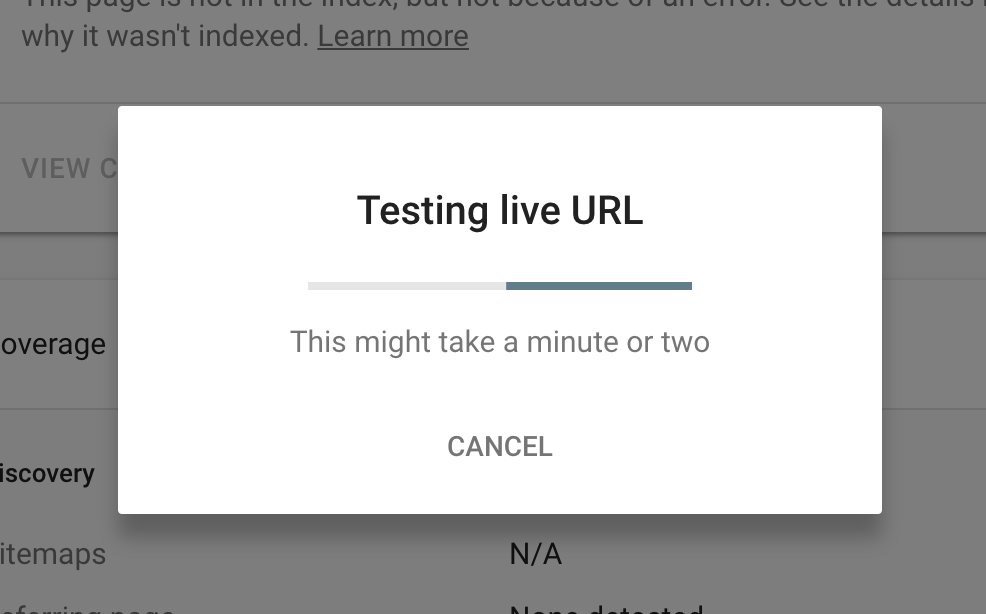
Methodology: We repeatedly mashed this button:
..until Google stopped showing us this:
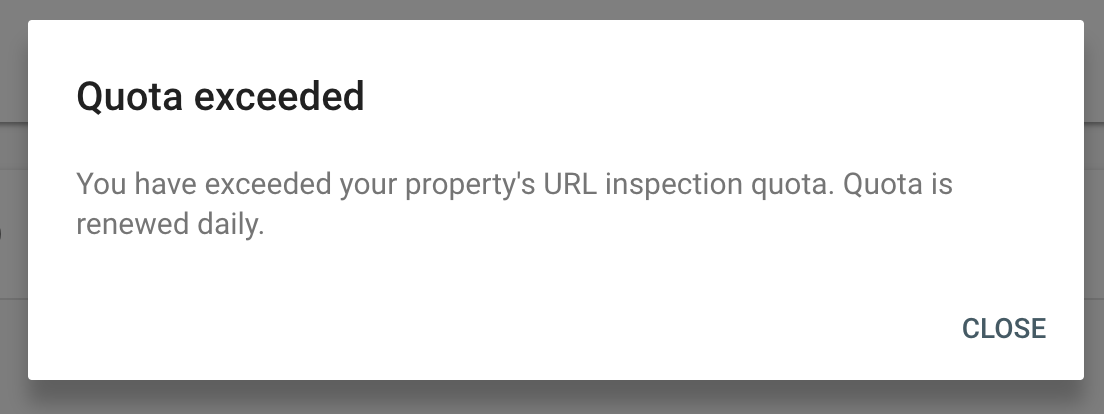
We quickly sailed past 10 attempts without a problem, on to 20, then 30. At 40 we wondered if there really was no limit, but, just as we were about to lose hope, on the 50th try:
tl:dr: The daily limit for Live URL Inspection is 50 requests.
How is knowing this actually useful?
Basic
If you’re planning a domain migration, you can add in to your migration plan a step to pick out your 50 most important URLs and manually request indexing on those pages on the day of the migration.
Intermediate
Taking that a step earlier, you could take the 100 most important pages and, once the redirects are in place, request indexing of 50 of the old URLs, through the old domain’s Search Console property, to pick up the redirects, whilst requesting indexing of the remaining 50 through the new domain’s Search Console property to quickly get those pages in the index.
Advanced
This is the ‘let’s try to break it’ option. 50 URLs is nowhere near Bing’s 10k URLs a day, but what if you could actually end up with more than 10k indexed through this technique?
Remember that you can register multiple properties for the same site. As a result there’s an interesting solution where you automatically register Search Console properties for each major folder on your site (up to Search Console’s limit of 400 in a single account) and then use the Live Inspection tool for 50 URLs per property – giving you up to 20k URLs a day – double Bing’s allowance! None of this would be particularly difficult using Selenium/Puppeteer; we’ve previously built out scripts to automatically mass-register Search Console properties for a client that was undergoing a HTTPS migration and had a couple of hundred properties they needed to move over, which went without a hitch. We didn’t use that script to mass request indexing, but, if you did, it could allow for a migration to occur extremely quickly. We don’t recommend doing this – I can’t imagine this is how Google wants you to use this tool, though equally I can’t think how they’d actively penalise you for doing this. Something, perhaps, to try out another day at your own risk. If you do, let me know how it works!
Does Google Crawl With HTTP2 Yet?
HTTP2 is a major revision to the HTTP protocol, agreed in 2015. At this stage it has pretty much universal support across web browsers. As HTTP2 supports multiplexing, server push, binary protocols, stream prioritisation and stateful header compression it is, in almost all instances, faster than HTTP1.1 and so implementing it can provide a relative ‘free’ speed boost to a site. But, how does Google handle HTTP2? We thought we’d find out.
The History
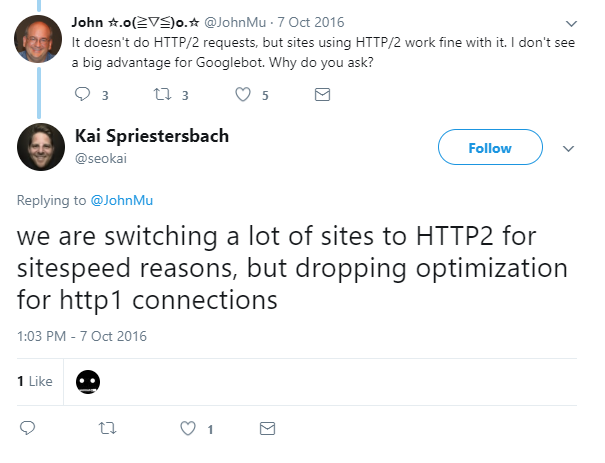
As HTTP2 is backwards compatible – if a browser doesn’t support HTTP2, HTTP1.1 is used instead – Google could read pages on HTTP2 sites the very first day the specification was built. Yet this backwards compatibility actually makes it difficult to tell whether Google is actually using HTTP2 or not. Mueller confirmed in 2016 that Googlebot wasn’t using HTTP2 yet:
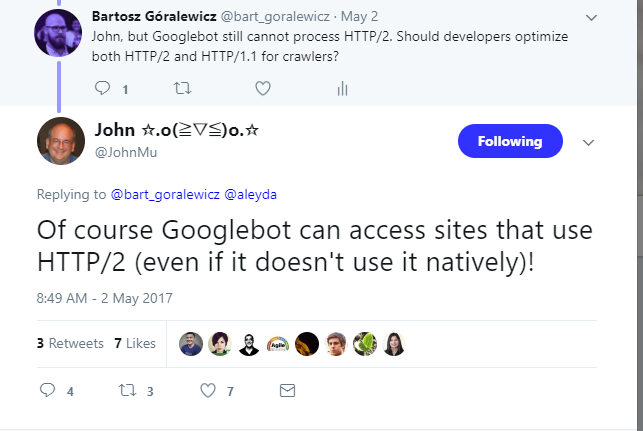
A year later, in 2017, Bartoz asked the same question and found that googlebot still wasn’t using HTTP2:
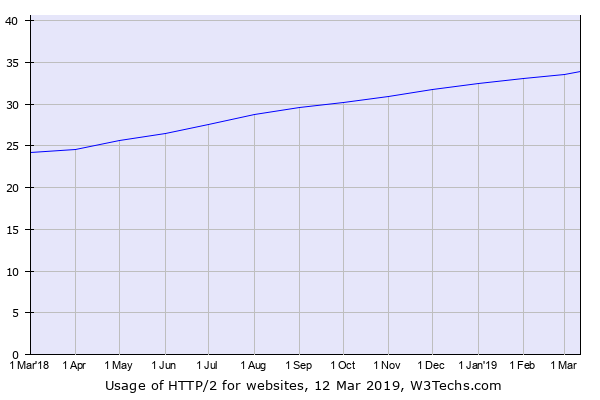
Two years later, much has changed, HTTP2 is now used by over a third of websites and that figure is growing by about 10% YoY:
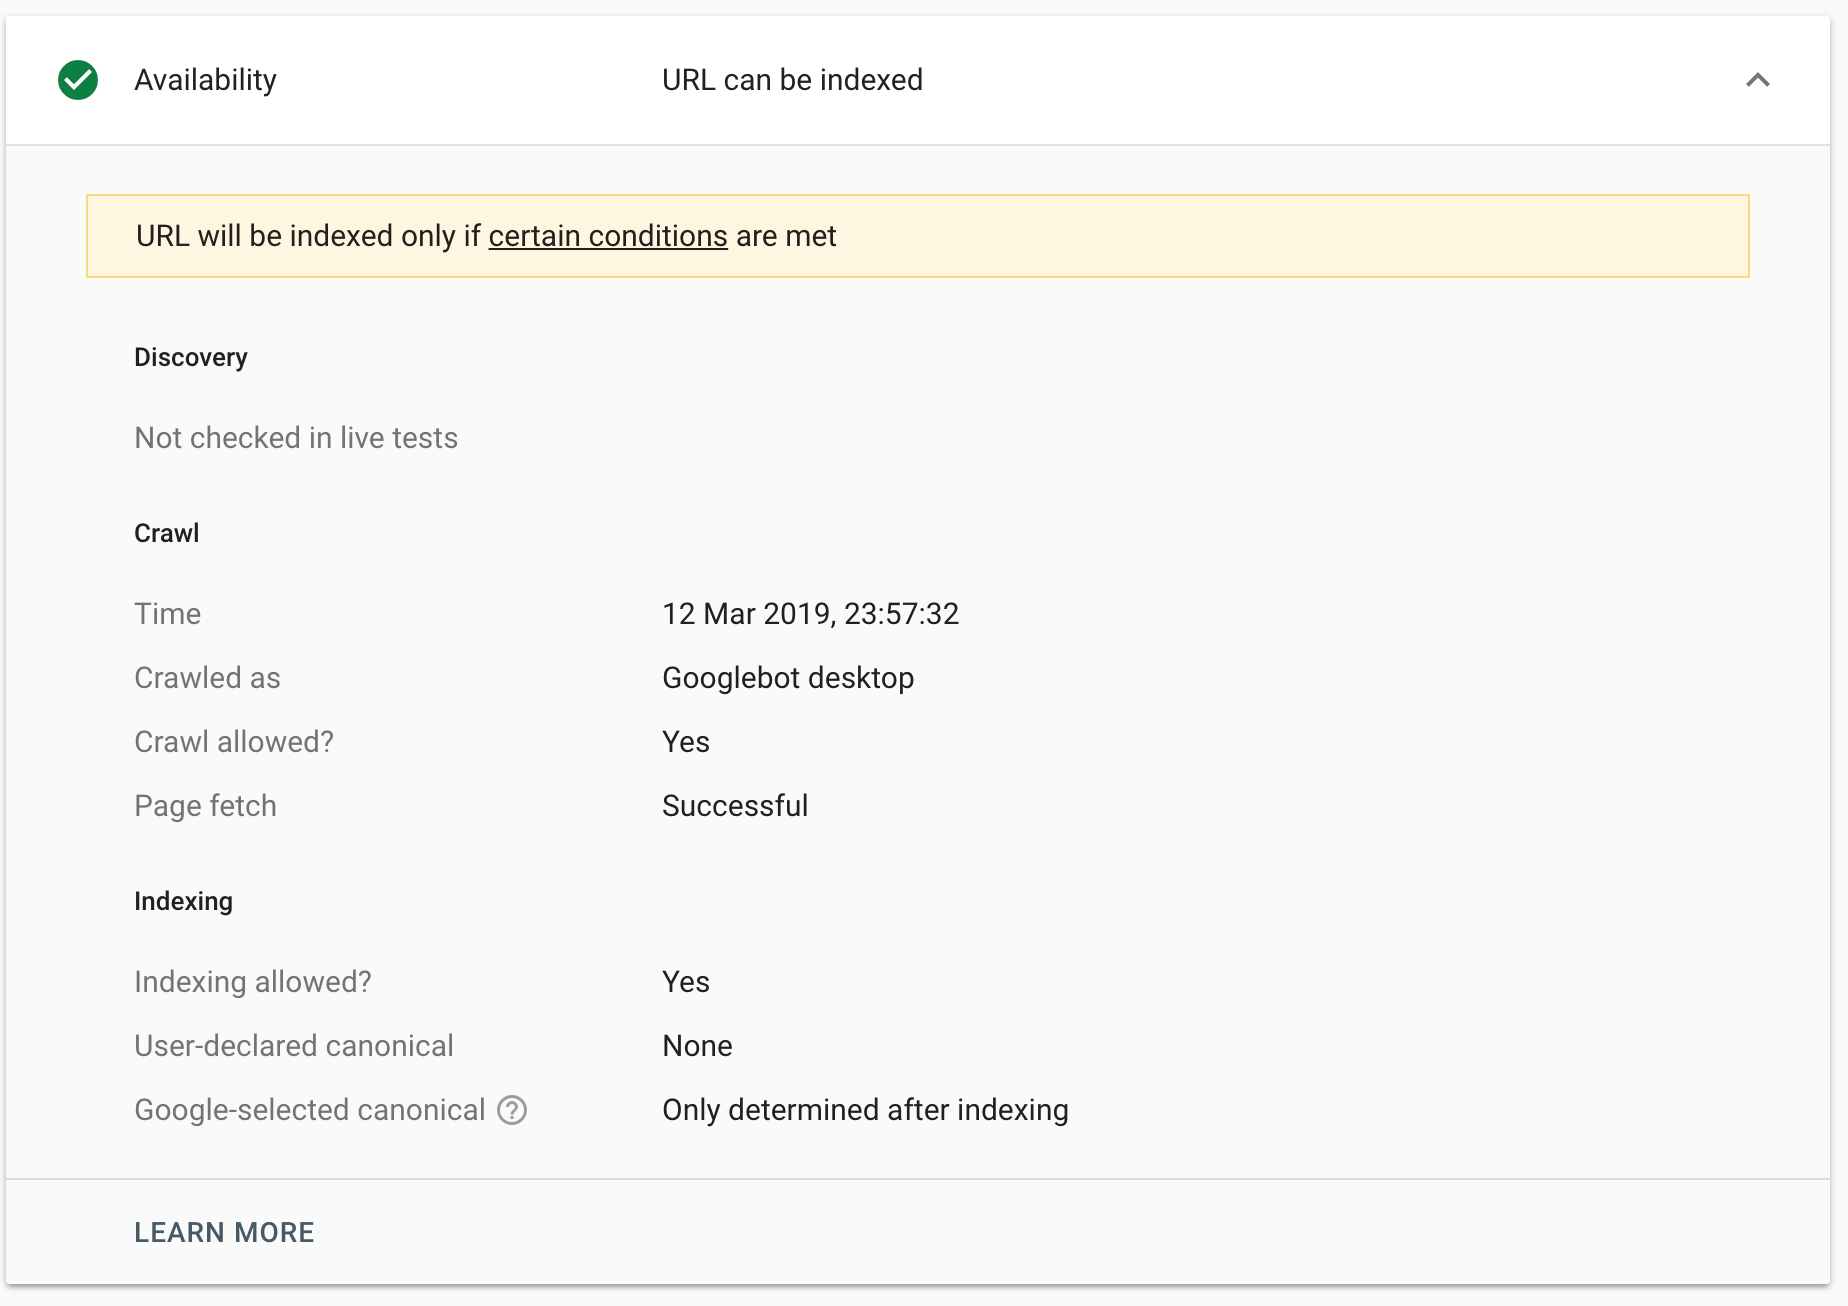
So, we thought we’d revisit the question. The setup was a little time consuming, but simple. We set up an Apache server with HTTPS and then HTTP2 support and made sure that Google could crawl the page normally:
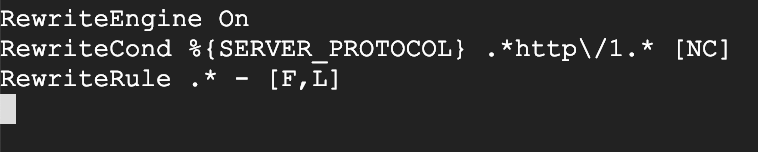
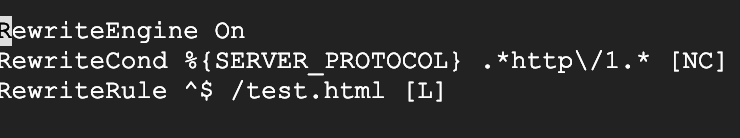
Once we knew that was working, we edited the .htaccess file to block all http1.* traffic:
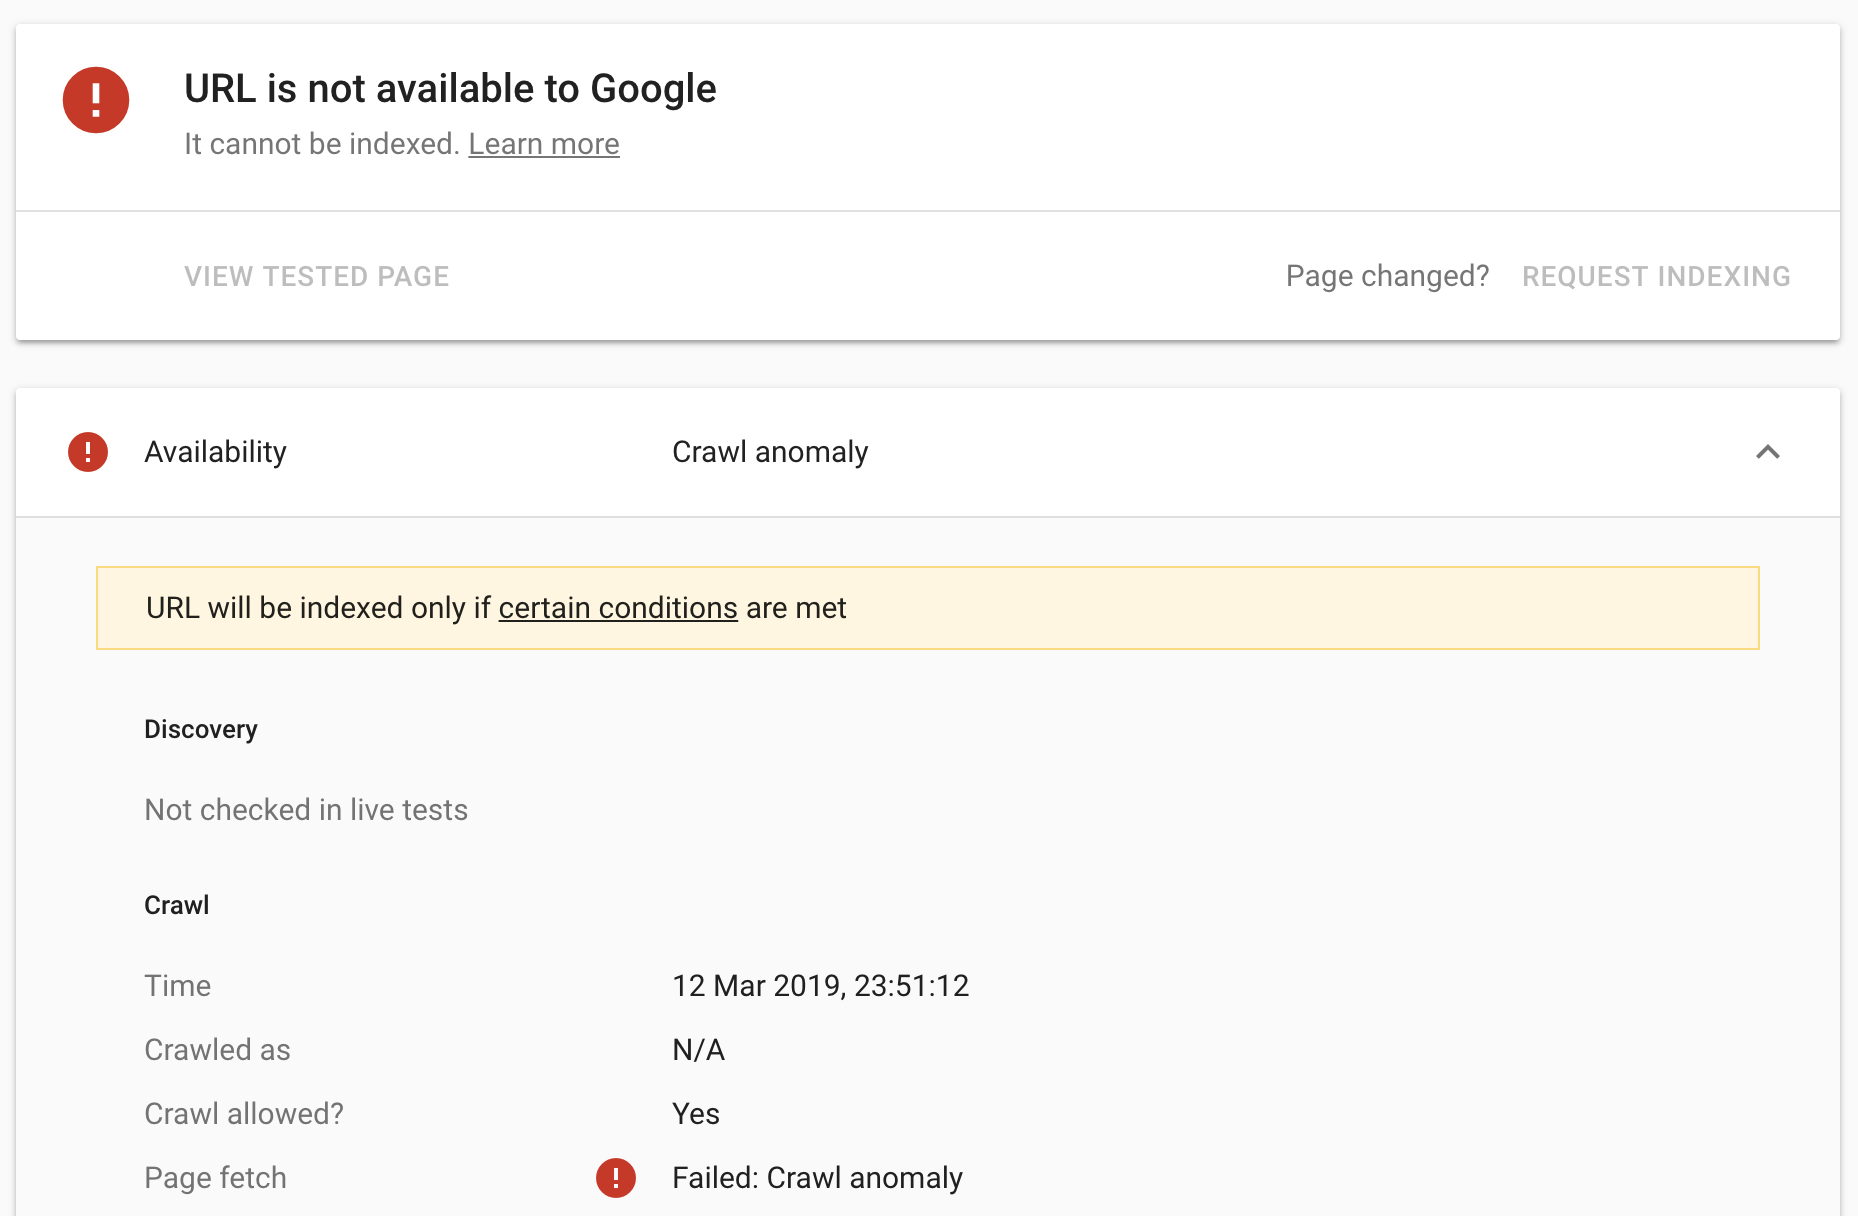
This time, when we requested Google recrawl the page, we received a crawl anomaly:
..and so no, googlebot still, somehow, does not support HTTP2. We wanted to see how Google would render the page as well, though. The assumption was that whilst Googlebot did not support HTTP2, WRS/Caffeine is based on Chrome 41, and Chrome 41 supports HTTP2, so, therefore, WRS should too. As a result, we changed the .htaccess file to, instead, redirect all HTTP 1.1 traffic to another test page:
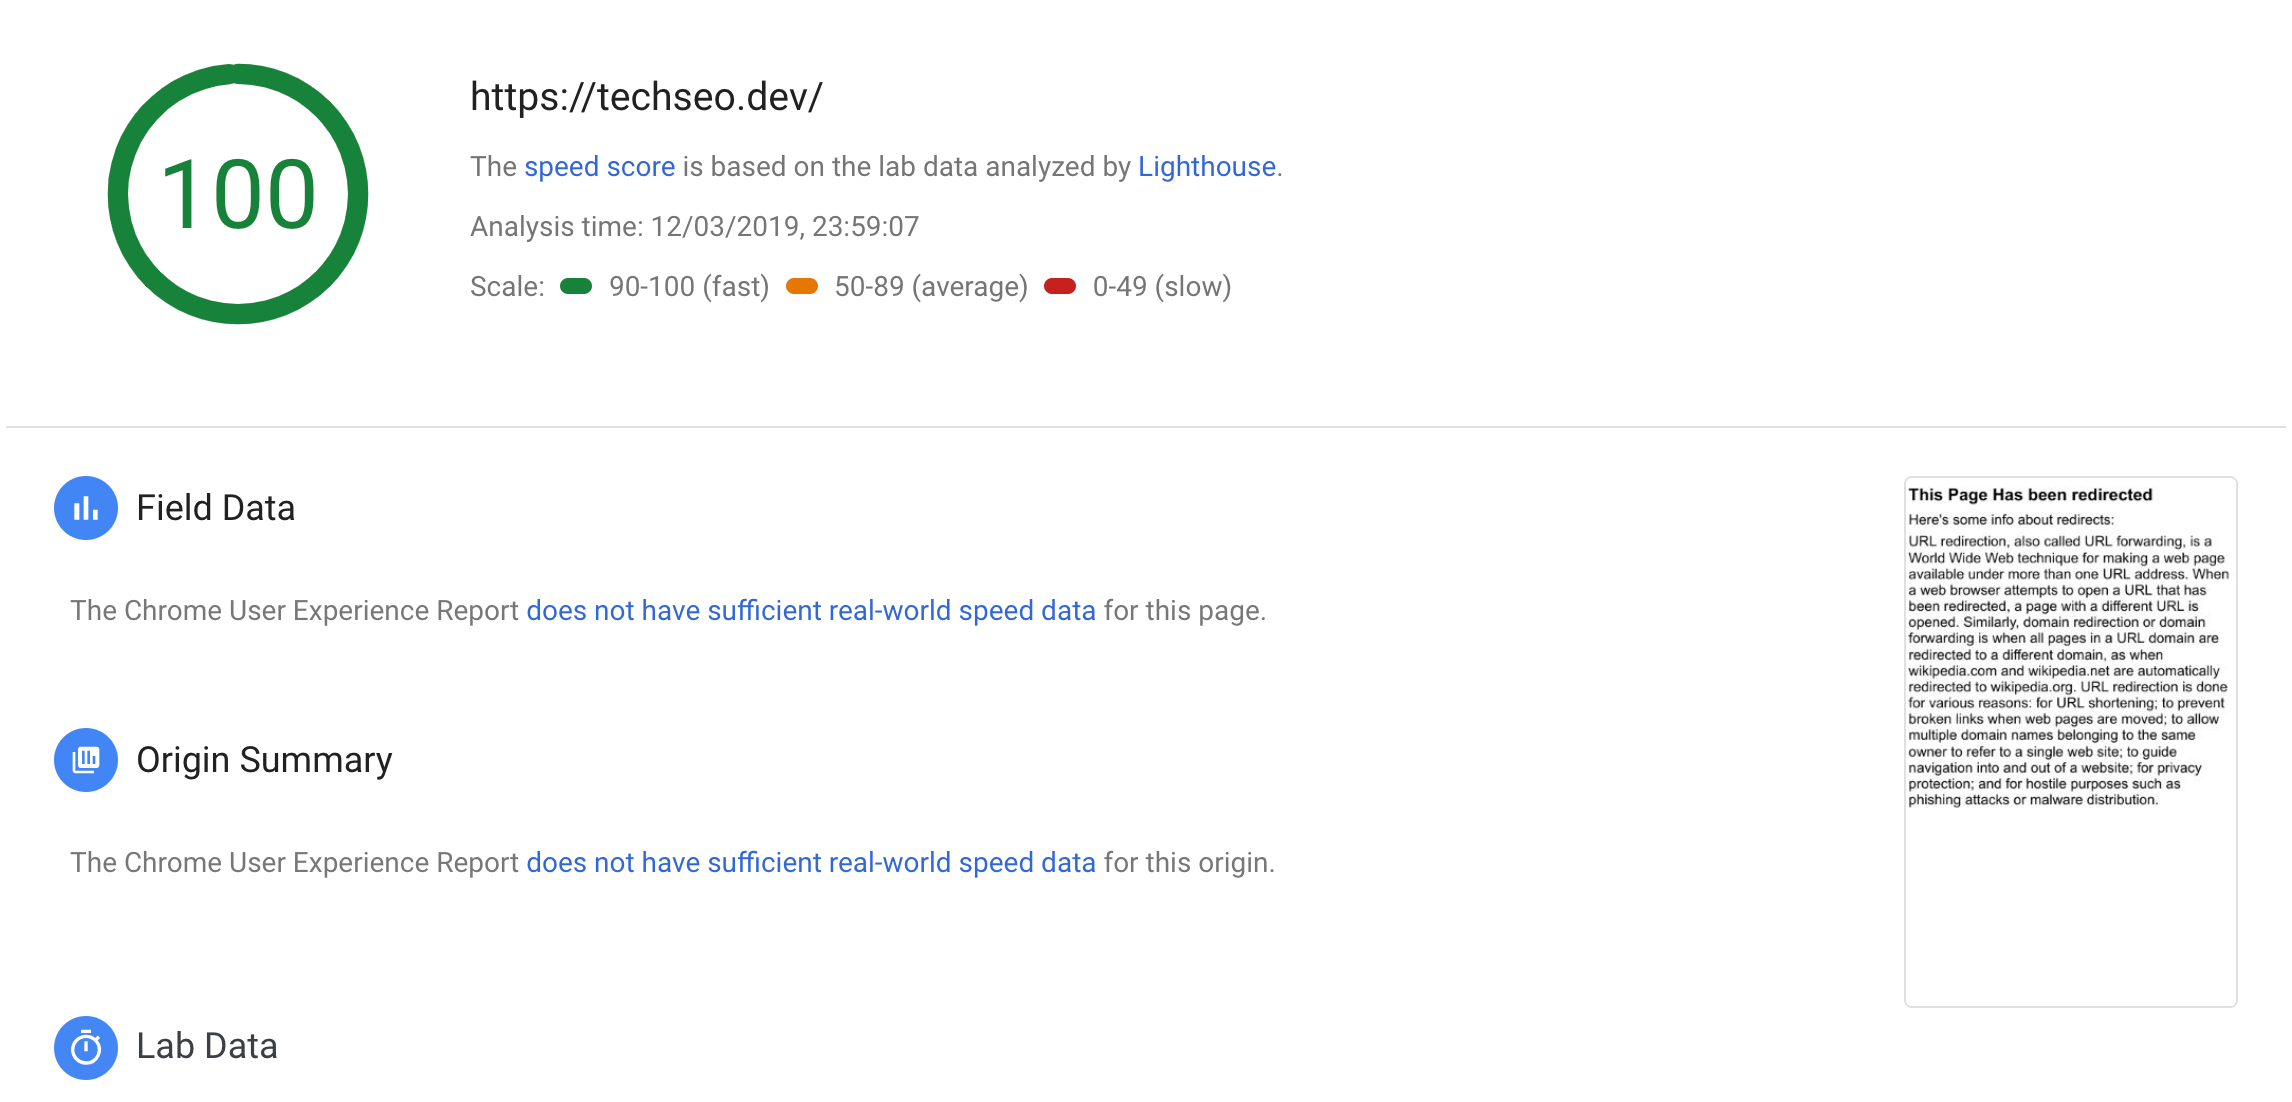
We then used PageSpeed insights to see how Google would render the page:
You may just about notice the preview in the bottom left is of a page with the headline ‘This page has been redirected’ – it loaded test.html rather than the homepage! So, for whatever reason, we must presume, that Google has hobbled WRS so that it always pulls the HTTP1.1 version of a page, which, in 99.999999% of cases would be identical to the HTTP2 version of the page.
Why does this matter?
This is interesting for two reasons:
1) It implies a very interesting way to cloak that I’ve not heard people talk about before. Internet Explorer has supported HTTP2 since 2013, whilst Firefox, Safari and Chrome have each had support since 2015. If you set certain content to only show for users with HTTP1.1 connections, as modern browsers all support HTTP2, effectively zero users would see it, but Google would. As with all cloaking, I don’t actually recommend this – and Google could add HTTP2 support at any time – but as ways of cloaking go, it would be difficult to detect as, effectively, nobody’s looking for it right now.
2) Due to HTTP2’s multiplexing abilities, there are several site speed recommendations that are different for HTTP1.1 than HTTP2 including, for example, spriting. Now that we know Google is not using HTTP2 even when your server supports it, by optimising your page for speed based on users using HTTP2 you might actually be slowing down the speed at which Google (still using HTTP1.1) crawls the page. Whilst Google’s tight-lipped on what mechanism, exactly, they use to measure site speed, the page load speed that googlebot itself finds will, of course, go to determining crawl budget. So if you’re really caring about crawl budget and are about to move to HTTP2 then you’ve got an interesting problem. This is simply one of those cases where what’s best for Google is not what’s best for the user. As such, there’s a reasonable case to be made that you shouldn’t prioritise, or potentially even bother implementing, any site speed changes that are different for HTTP1.1 than HTTP2 when moving to HTTP2 – at least until Google starts crawling with HTTP2 support… or you could combine both approaches and change the way you’re delivering CSS, icons etc based on the HTTP version that’s supported by the requested user, which is a lot of extra work, but technically optimal. That is, as we all know, the best kind of optimal.
Mostly, it’s just interesting though.
SEO Metric Ranking Correlation Study
When we first started link building we’d talk about raw number of links. Most would like to think that those days are gone and that, since Penguin, quality matters more than quantity. As a result, many have moved to talking about number of links above a certain metric – typically Domain Authority or TrustFlow. Yet this is only useful, beyond a raw measure of amount of links, if you believe that the metric tells you something meaningful and comparative about those links.
Almost every day we get asked how many links a campaign has generated and when we enter campaigns in for awards we know the raw number of links is key. The lack of adoption of these link metrics as the true arbiter of a links value is, we think, evidence that they might not be very indicative of quality at all.
The Problem with Most Metrics
If you’re a tool provider, chances are you have your own metric; Moz has DomainAuthority, Majestic has TrustFlow, AHrefs has Domain Rating, etc. Yet, as a tools provider, you have significant limitations including:
You’re limited to your own database(s) as incorporating a competitors implies yours isn’t up to the task.
Your databases are mostly link databases and so you’ll need to heavily weight how you measure quality to take into account links.
Your audience is, usually, geographically centred around a handful of countries and, so, you’re incentivised to use those countries data for testing and so make it as true as possible in those countries. To be fair here, for anyone that’s played with Google outside of an English-language-speaking country you’ll know that this bias isn’t just limited to tool providers.
In a world where we know Google takes over 200 different factors in assessing rankings, and tool providers typically take into account less than a handful, we don’t think it should be surprising that the metrics don’t correlate well with rankings. So, we decided to find out.
Earlier this year SEOMonitor was kind enough to send us through over 450k SERPs, containing 4.5 million ranking positions worth of data. This data was UK rankings for commercial terms with at least 1k searches a month in the UK. We only gave them a vague understanding of what we’d use the data for so that no funny business could occur (once again, thanks SEOMonitor team for putting up with our seemingly random requests).
For the purpose of this first study we randomly selected 1k of those 450k SERPs and, for each page ranking, we collected:
Majestic Domain-Level TrustFlow
Majestic Domain-Level CitationFlow
Majestic Page-Level TrustFlow
Majestic Page-Level CitationFlow
Moz Page Authority
Moz Domain Authority
Moz MozRank
Moz Subdomain-level MozRank
AHrefs Domain Rating
We then combined and averaged each metric for each ranking position to produce the graph below:
If we’re honest, we were surprised with quite how well each correlated. There is a clear pattern of sites ranking better receiving higher scores from each of the metrics – with MozRank (Subdomain) and CitationFlow just coming out top. Here are the correlation scores:
Yet this is a pretty easy test – we’d likely get the same results if we looked at average:
readership
number of URLs
direct traffic
any number of factors that clearly aren’t ranking factors and naturally increase as a sites importance increases
That doesn’t mean that any of these are a good indication of what order sites might rank in and, as a result, their ability to predict future ranking success. As a result, we asked a harder question – what percentage of ranking positions could each metric accurately predict? The results, it turned out, were not encouraging:
We found that:
The majority of metrics struggled to predict more than 15% of the ranking positions. To put it another way, if you looked at a random SERP the majority of the time each individual metric was unlikely to guess the right order for more than one of the ten results.
What’s not shown in the data is that, when they did, it was typically predicting the number one position where the number one position was so dominant that it was incredibly obvious it deserved to be first.
Surprisingly, given their comparatively small index, Moz’ Page Authority correlated the most with rankings, whilst MozRank (despite it’s name) correlated the worst.
Yet there’s something weird going on here – MozRank wins the test and comes dead last in another? The answer, it turns out, is what happens when MozRank gets it wrong. Imagine a site is ranking position 1, in this example, TrustFlow predicts it should rank in position 2, whilst MozRank predicts it should rank position 10. They’re both wrong and so if you’re judging purely on how many results it gets right or wrong the two metrics are equal, but it’s important that, when a site gets it wrong it gets it at least wrong as possible. It turns out that when MozRank gets it wrong, it gets it way more wrong than most other metrics:
So the trite answer might be ‘use and asses a range of metrics’. <sigh> Or, if we’re being cynical – ‘all SEO metrics are equally bad at assessing a link’s potential value, they’re just bad in different ways‘.
This is inevitable and, we think, only going to get worse given the increasing complexity of what ranks where and why.
What Makes a Good Link
Beyond the number of links and authority that a site has there are a few things that, as humans, we naturally take into account including:
Where on the page the link is – is it in content or in the sidebar or footer.
The language of the linking page to the page it’s linking to – why is an Estonian site linking to your English product page, aimed at people in the UK, and why should I trust their opinion on buying products in the UK?
The relevance of the linking page to the page it’s linking to – everyone’d much prefer a link in an article all about what I do that in one talking about something completely unrelated.
How Google’s treating the site you’re getting a link from – if you know that a site’s just got a penalty, would you want a link from it?
Each of these, are obviously important, from a human perspective, but not taken into account, at all, by the tools providers metrics. That’s why the metrics can’t work out the ranking well.
What can you do about it?
Be smart on what you’re reporting on. You might want to consider reporting on:
Social shares
Coverage views
Rankings and (YoY) Traffic/Revenue changes
We got so frustrated with this that, years ago, we built LinkScore. Taking into account more than a dozen off and on-page metrics it provides a score out of 500 for likely a link is to improve the ranking of the linked page in the target country. This is also handy in terms of how you setup your outreach team for success. If all you want from them is high DA sites don’t be surprised to get comment spam and other ‘tactics’ to achieve those KPIs. Their KPIs need to follow your KPIs as an agency, which need to support your clients KPIs.
Ultimately, we’re not saying don’t use tool provider metrics – they’re a quick and dirty indication – but be aware of their limitations and plan towards the things that actually make a difference to your clients.
Comparing Screaming Frog Crawl Files
Handing over technical recommendations often comes with some trepidation; how long might it take for them to be implemented, will they be implemented at all and, if so, will they be implemented correctly? That’s why understanding how development cycles occur, how items are prioritised and who you need to get onside is as key to successful technical SEO as the recommendations themselves. However well you understand those, though, changes are often implemented without any feedback that they’re now complete.
It’s for that reason that tools like ContentKing have sprung up; to keep an eye on the site and alert you of changes. It’s not always feasible to run SaaS crawlers on the site, though. As a result, many of us rely on running crawls with Screaming Frog’s crawler. Comparing crawl files can be a pain. Usually, you’ll end up dumping the data into excel and run a bunch of VLOOKUPS or MATCH/INDEX functions only to find that no, the developer hasn’t implemented the changes.
Meanwhile, you’ll occasionally want to compare crawl files of different sites to:
Compare a dev environment with a staging environment
Make sure content has been ported to a new site correctly
Run technical SEO competitive analysis/comparisons – we wrote about this recently here.
This has always been a pain, which is why, for a while now, we’ve had a tool that quickly compares crawl_overview files for us. Today, we’re making it available for free.
It’s a simple Python script. If you don’t have Python installed, you can read a guide for Windows here and for MacOS here (you’ll need Python 2, rather than 3, for the script to work – though feel free to install both using virtual environments if you’re really keen on 3). The script itself, is here:
import pandas
import csv
import sys

from tqdm import tqdm


class color:
   PURPLE = '33[95m'
   CYAN = '33[96m'
   DARKCYAN = '33[36m'
   BLUE = '33[94m'
   GREEN = '33[92m'
   YELLOW = '33[93m'
   RED = '33[91m'
   BOLD = '33[1m'
   UNDERLINE = '33[4m'
   END = '33[0m'


def main(argv):
	if len(argv) != 4:
		print 'Usage: programname.py crawl_overview1.csv crawl_overview2.csv output.csv'
		sys.exit()

	headerrows = 5
	endline = 191

	fileone = get_csv(argv[1])
	filetwo = get_csv(argv[2])

	fileone = fileone[0:endline]
	filetwo = filetwo[0:endline]

	fileonesite = fileone[1][1]
	filetwosite = filetwo[1][1]

	fileone = fileone[headerrows:]
	filetwo = filetwo[headerrows:]

	fileonedata = []
	filetwodata = []
	combineddata = []
	firstcolumn = []

	firstcolumn.extend(get_column(fileone,0))
	fileonedata.extend(get_column(fileone,1))
	filetwodata.extend(get_column(filetwo,1))
	combineddata.extend(zip(firstcolumn,fileonedata,filetwodata))


	outFile = csv.writer(open(argv[3], 'w'))
	outFile.writerow(["",fileonesite,filetwosite])
	for i in tqdm(combineddata):
		outFile.writerow(i)

	if fileonedata == filetwodata:
		print (color.BOLD + color.RED + "Crawl files are identical" + color.END)
	else:
		print (color.BOLD + color.GREEN + "Crawl files are NOT identical" + color.END)

def get_csv(thefile):
	datafile = open(thefile, 'r')
	datareader = csv.reader(datafile, delimiter=",")
	data=[]
	for row in tqdm(datareader):
		data.append(row)
	datafile.close()
	return data

def get_column(thelist,thecolumn):
	newlist =[]
	for row in tqdm(thelist):
		if len(row) >= thecolumn +1:
			newlist.append(row[thecolumn])
		else:
			newlist.append("")
	return newlist

if __name__ == '__main__':
  main(sys.argv)
The only thing you might need to pip install is tqdm – which if you’re not already using we heartily recommend – it creates the nice little loading bars. If you’re new to Python and the script errors when you run it, mentioning tqdm, simply type:
pip install tqdm (on windows)
sudo pip install tqdm (on Mac)
You’ll only ever need to do that once.
Save it in a folder, navigate to that folder using command prompt or terminal and then run it the same way you’d run any Python script (typically ‘Python <nameoffile.py>’). It takes two inputs:
The name of the first crawl_overview file
The name of the second crawl_overview file
The name of file you’d like to save the output as – it should be a csv, but doesn’t need to already exist
Both files should be in the same folder as the Python script and so a valid input would look something like this:
The script’s pretty fast – it’ll chew through the files within seconds and then report that either ‘Crawl files are identical’ or ‘Crawl files are NOT identical’. It will have saved a file called ‘comparison.csv’ in the same directory that compares both crawl files – ready for you to:
Send onwards as proof as to whether recommendations have or haven’t been implemented; or
Create industry comparison graphs to show how the sites compare; or
do with as you please.
Future Updates
Now that the script is publicly available there are a few changes we plan to make to it. These include:
Creating a front-end and installer for those who don’t like to mess around with Python
Allowing for the comparison of multiple crawl_overview files at once
Allowing for the comparison of other Screaming Frog outputs – not just crawl_overview files.
We’d love your feedback as to what features you’d like to see added.

 We also share, across a couple of other channels, TV, radio and print coverage: