Measuring Page Speed Performance Using Google Metrics and Tools

Speed has been always one of the most important metrics when measuring a website’s performance, as well as one of the confirmed desktop ranking factors since 2010.
Nowadays we are in a mobile era and speed is even more important after Google rolled out the Mobile-first indexing last March 2018, announcing that they are using primarily the mobile version of the page for indexing and ranking, and later on in July they rolled out the “Speed Update”, which enables page speed as a mobile search ranking factor.
The importance of Site Speed for E-commerce
Speed matters, so the faster your pages loads, the better. If we analyse the top 10 results for a specific query, we’ll find that relevant fast sites rank better, because speed matters for both users and Google; they want to find the best result to their queries as fast as possible. Research has found that:
- 53% of mobile users are likely to leave the page if it doesn’t load within 3s.
- One out of two people expect a page to load in less than 2s.
- 46% of people say that waiting for pages to load is what they dislike the most when browsing the web on mobile devices.
It is important to understand that speed performance influences business ROI, that’s why in-depth technical SEO audits should include site speed analysis. It has been demonstrated that a page’s speed has a big influence in bounce rates, traffic, conversion rates and sales.
Google Tools for Website Speed Tests
When it comes to measuring speed, there are different tools for analysing your site’s performance that will help you determine the technical improvements needed to achieve better results, including Google tools such as:
- PageSpeed Insights
- Lighthouse
- Speed Scorecard
- Chrome Dev Tools
Google PageSpeed Insights is a free tool that analyses a page’s performance, and also displays a speed score for any given page, from 0 to 100, for both devices mobile and desktop. (Check out PageSpeed Insights here)
Google PageSpeed Insights tool has been updated recently, on November 2018, and it now includes more data form Lighthouse and the Chrome User Experience Report (CRUX) with real-world data. The reports are very useful and you can find important performance metrics such as First Contentful Paint (FCP) and First Meaningful Paint (FMP), both key metrics to know how quickly a page loads. It also includes speed optimisation recommendations such image optimisation and render-blocking JavaScript.
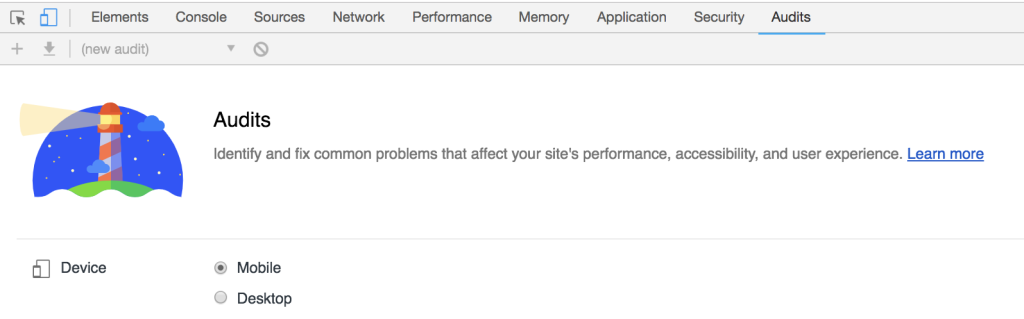
Lighthouse is another free open-source tool developed by Google to audit web performance and the quality of web pages. It highlights the issues which cause a low-performance score and creates a report with opportunities (listing things that could be improved for better performance) and diagnostics. The actions suggested to optimise speed are prioritised by the impact they have on the web performance of a page, which is useful when communicating with web development teams. To use Lighthouse, there are two options: you can either install a plugin on your chrome browser or check the lighthouse tool on built-in dev tools, under the “Audit” tab.
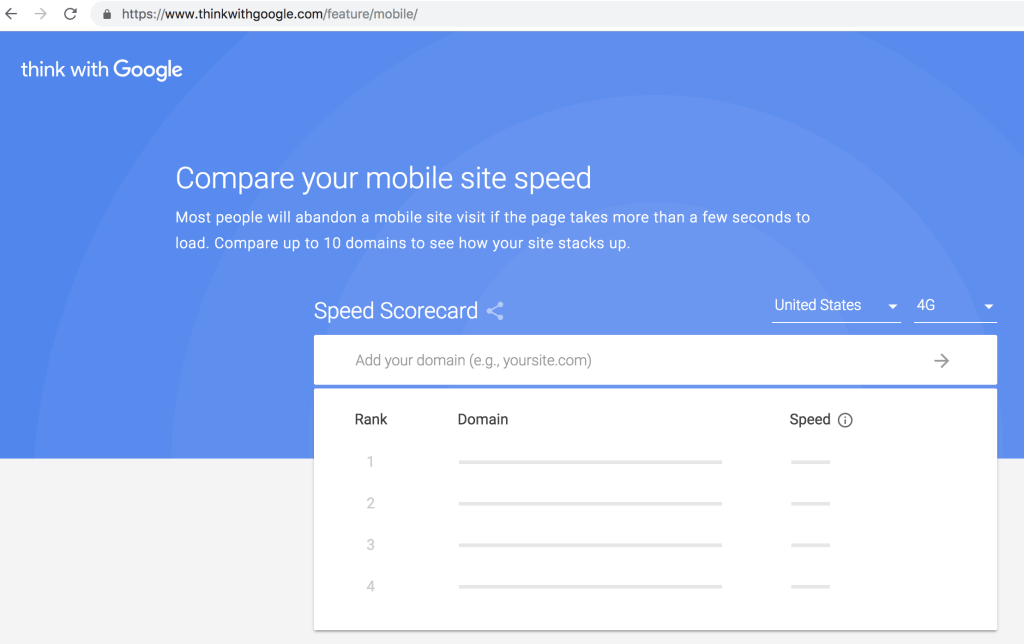
Speed Scorecard is very useful to benchmark mobile site speed ranks against competitors. The speed scorecard metric is calculated combining several metrics from Chrome User Experience Reports. It is possible to check the score in different countries and networks (4G, 3G). Another interesting feature included is the Impact calculator, which measures the impact of speed over companies revenue. To obtain a personalised result, you should fill the required metrics: average monthly visitors, average order value and conversion rate.
Chrome Dev Tools is a set of web developer tools built directly into the Chrome browser. The main use is to find and diagnose site’s issues, helping developers to fix bugs and issues quickly. With Chrome dev tools anyone can view and change any page, although the modifications are only displayed temporary for the user and they don’t get recorded.
In addition to the mentioned tools, Google has recently launched a new tool: web.dev, which looks at performance, PWA and best practices. I recommend using it with caution as the tool is still in beta and there have been bugs reported. The audit does provide a list of items to fix or optimise, along with notes on the impact of each change.
What should you work on to improve your website speed performance?
The main page elements that affect loading times and therefore speed are: images, JavaScripts and fonts. The bigger the size, the more time is needed to load the page. It is important to always benchmark results with main competitors, to see how that vertical or industry is performing, and this will help us elaborate the specific recommendations. Speed is a metric that should be always evaluated within a context.
The main elements and metrics worth checking using Google tools and to focus on improving for better speed performance are the following:
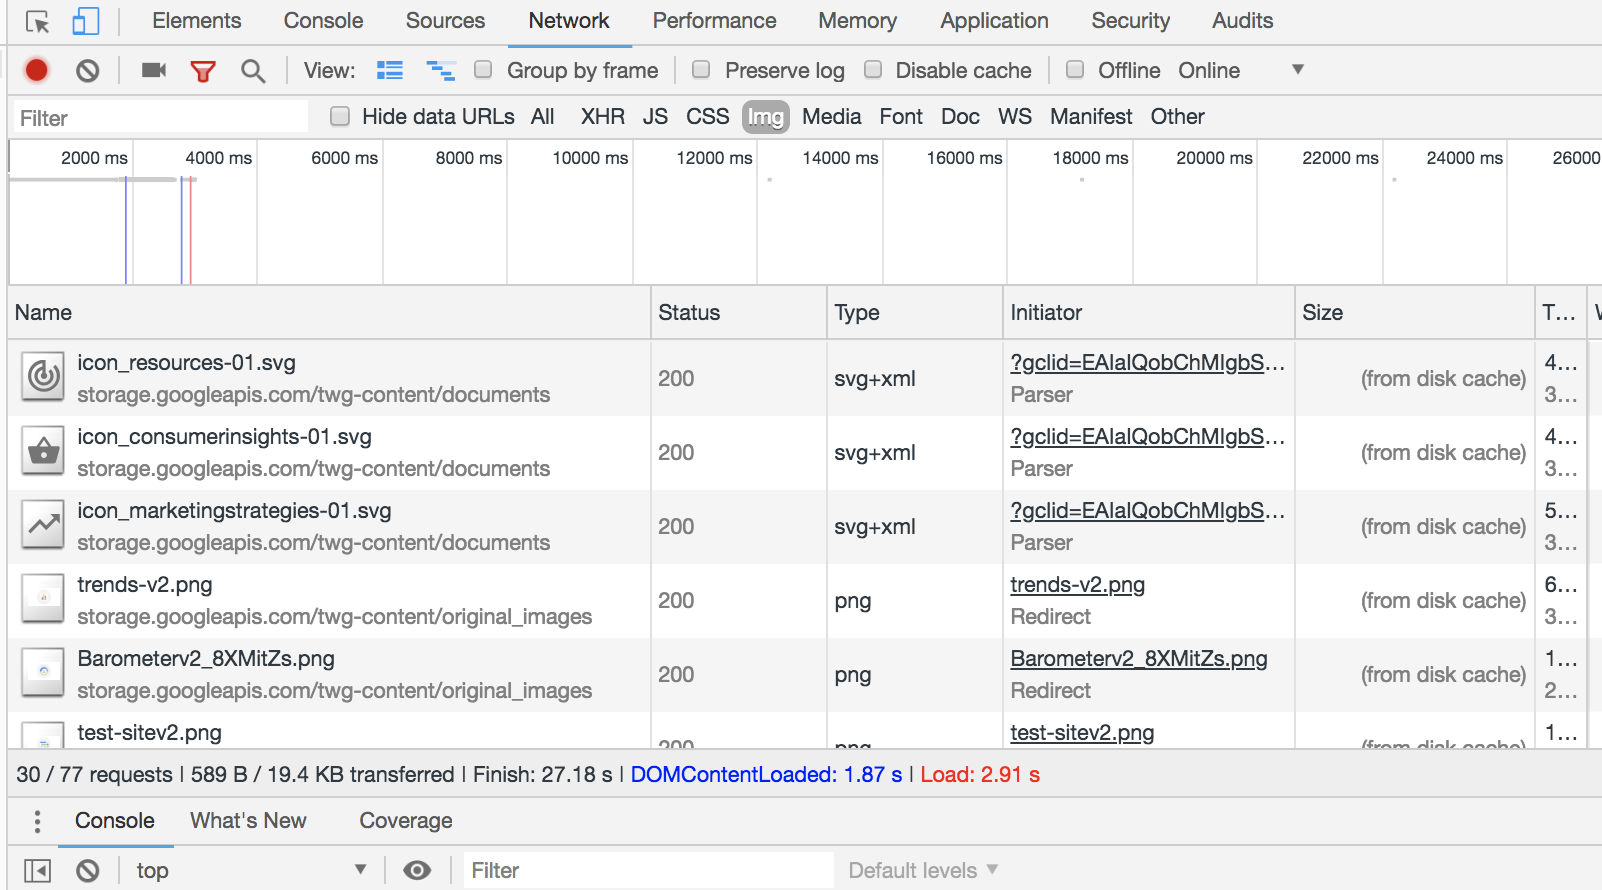
- Page size: This can be checked using Chrome Dev Tools, under the Network tab. It’s necessary to empty cache and hard reload, then check the transferred KB or MB that appear on the grey mid bar.
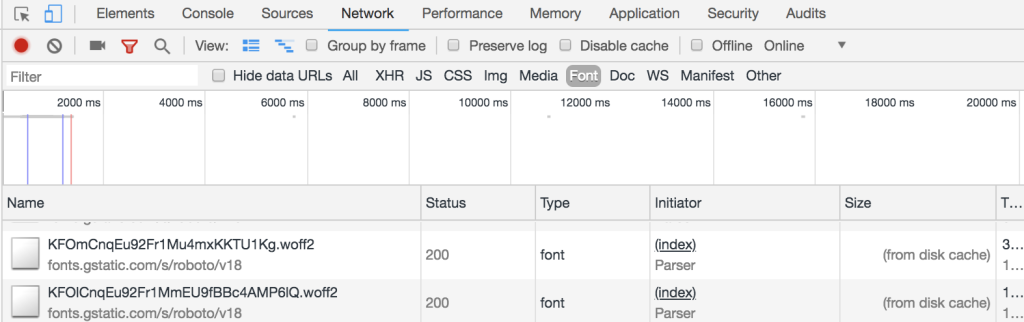
- Fonts: You can check the fonts used for each page also with Chrome Dev Tools, in the Network tab > Font. Webfont optimisation is a critical piece of the overall performance strategy. Loading times will depend upon the fonts selected and and even some fonts may block rendering of the text.
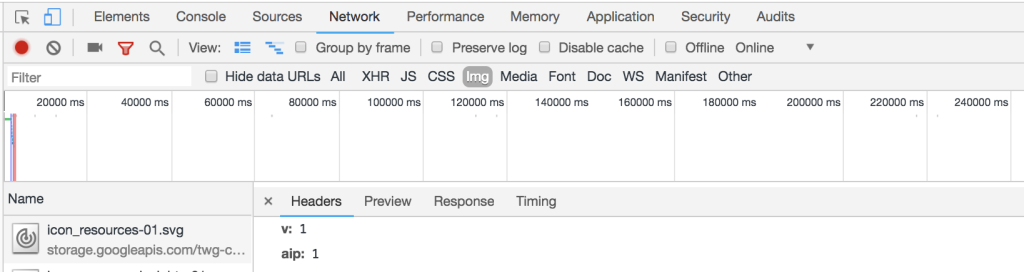
- Compression: You can check if there is any compression used on any given page on the HTTP headers. Once you have the developer tools open, click on the Network tab, and reload the page. Then click on the top entry of the resources list and select Headers on the right side. Look for the “Content-Encoding” field, and you’ll see if there’s any compression method being used.
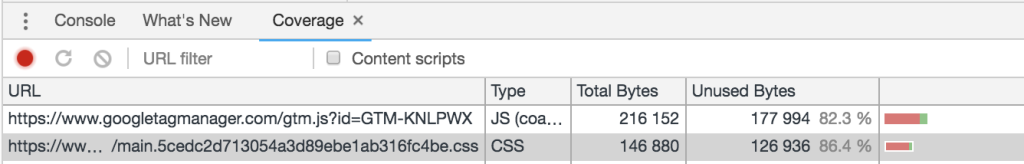
- Unused Bytes of Content: You can check unused bytes of content for JavaScript and CSS files. Take this information as an indication only, as the results might not be too accurate. It may have parts marked as unused but that will be triggered by user interactions. To check what percentage is marked as unused, go to the Coverage tab on the Google Chrome Dev Tools, reload the page and check the metrics displayed for each file. The unused parts of code are also highlighted in red on the tab.
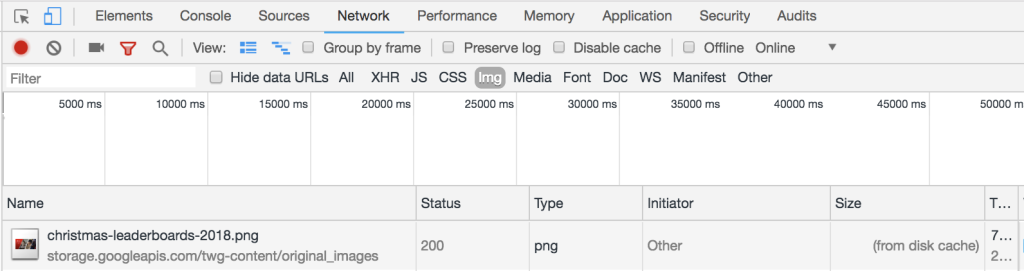
- Images Size: It’s possible to check the size of images with Chrome Dev Tools. Under the “Network” tab click “Img” and a list of images will be displayed showing status code, file type and size.
For further image optimisation, you can use Chrome Lighthouse, this is available under the Audit tab on the Chrome Dev Tools or as a standalone tool as previously mentioned. A great metric to check there is whether the images are being uploaded bigger than needed. For that, check the aspect ratio section, to know if the appropriate aspect ratio is being used.
If you have any other tips or if you want to share other useful things to check web speed performance using Google Tools, you can leave a comment below, it would be great to hear your thoughts!